Viewing execution logs
The execution log shows you exactly what MoveData did when processing a notification. It records every step in the processing pipeline, making it your most powerful tool for understanding what happened and diagnosing issues.
How to open the execution log#
- Open the Notifications tab in the MoveData app.
- Click a notification to open its detail view.
- Select the Execution tab.
Warning
If the Execution tab is empty, logging may not be enabled. See Log settings below to turn it on.
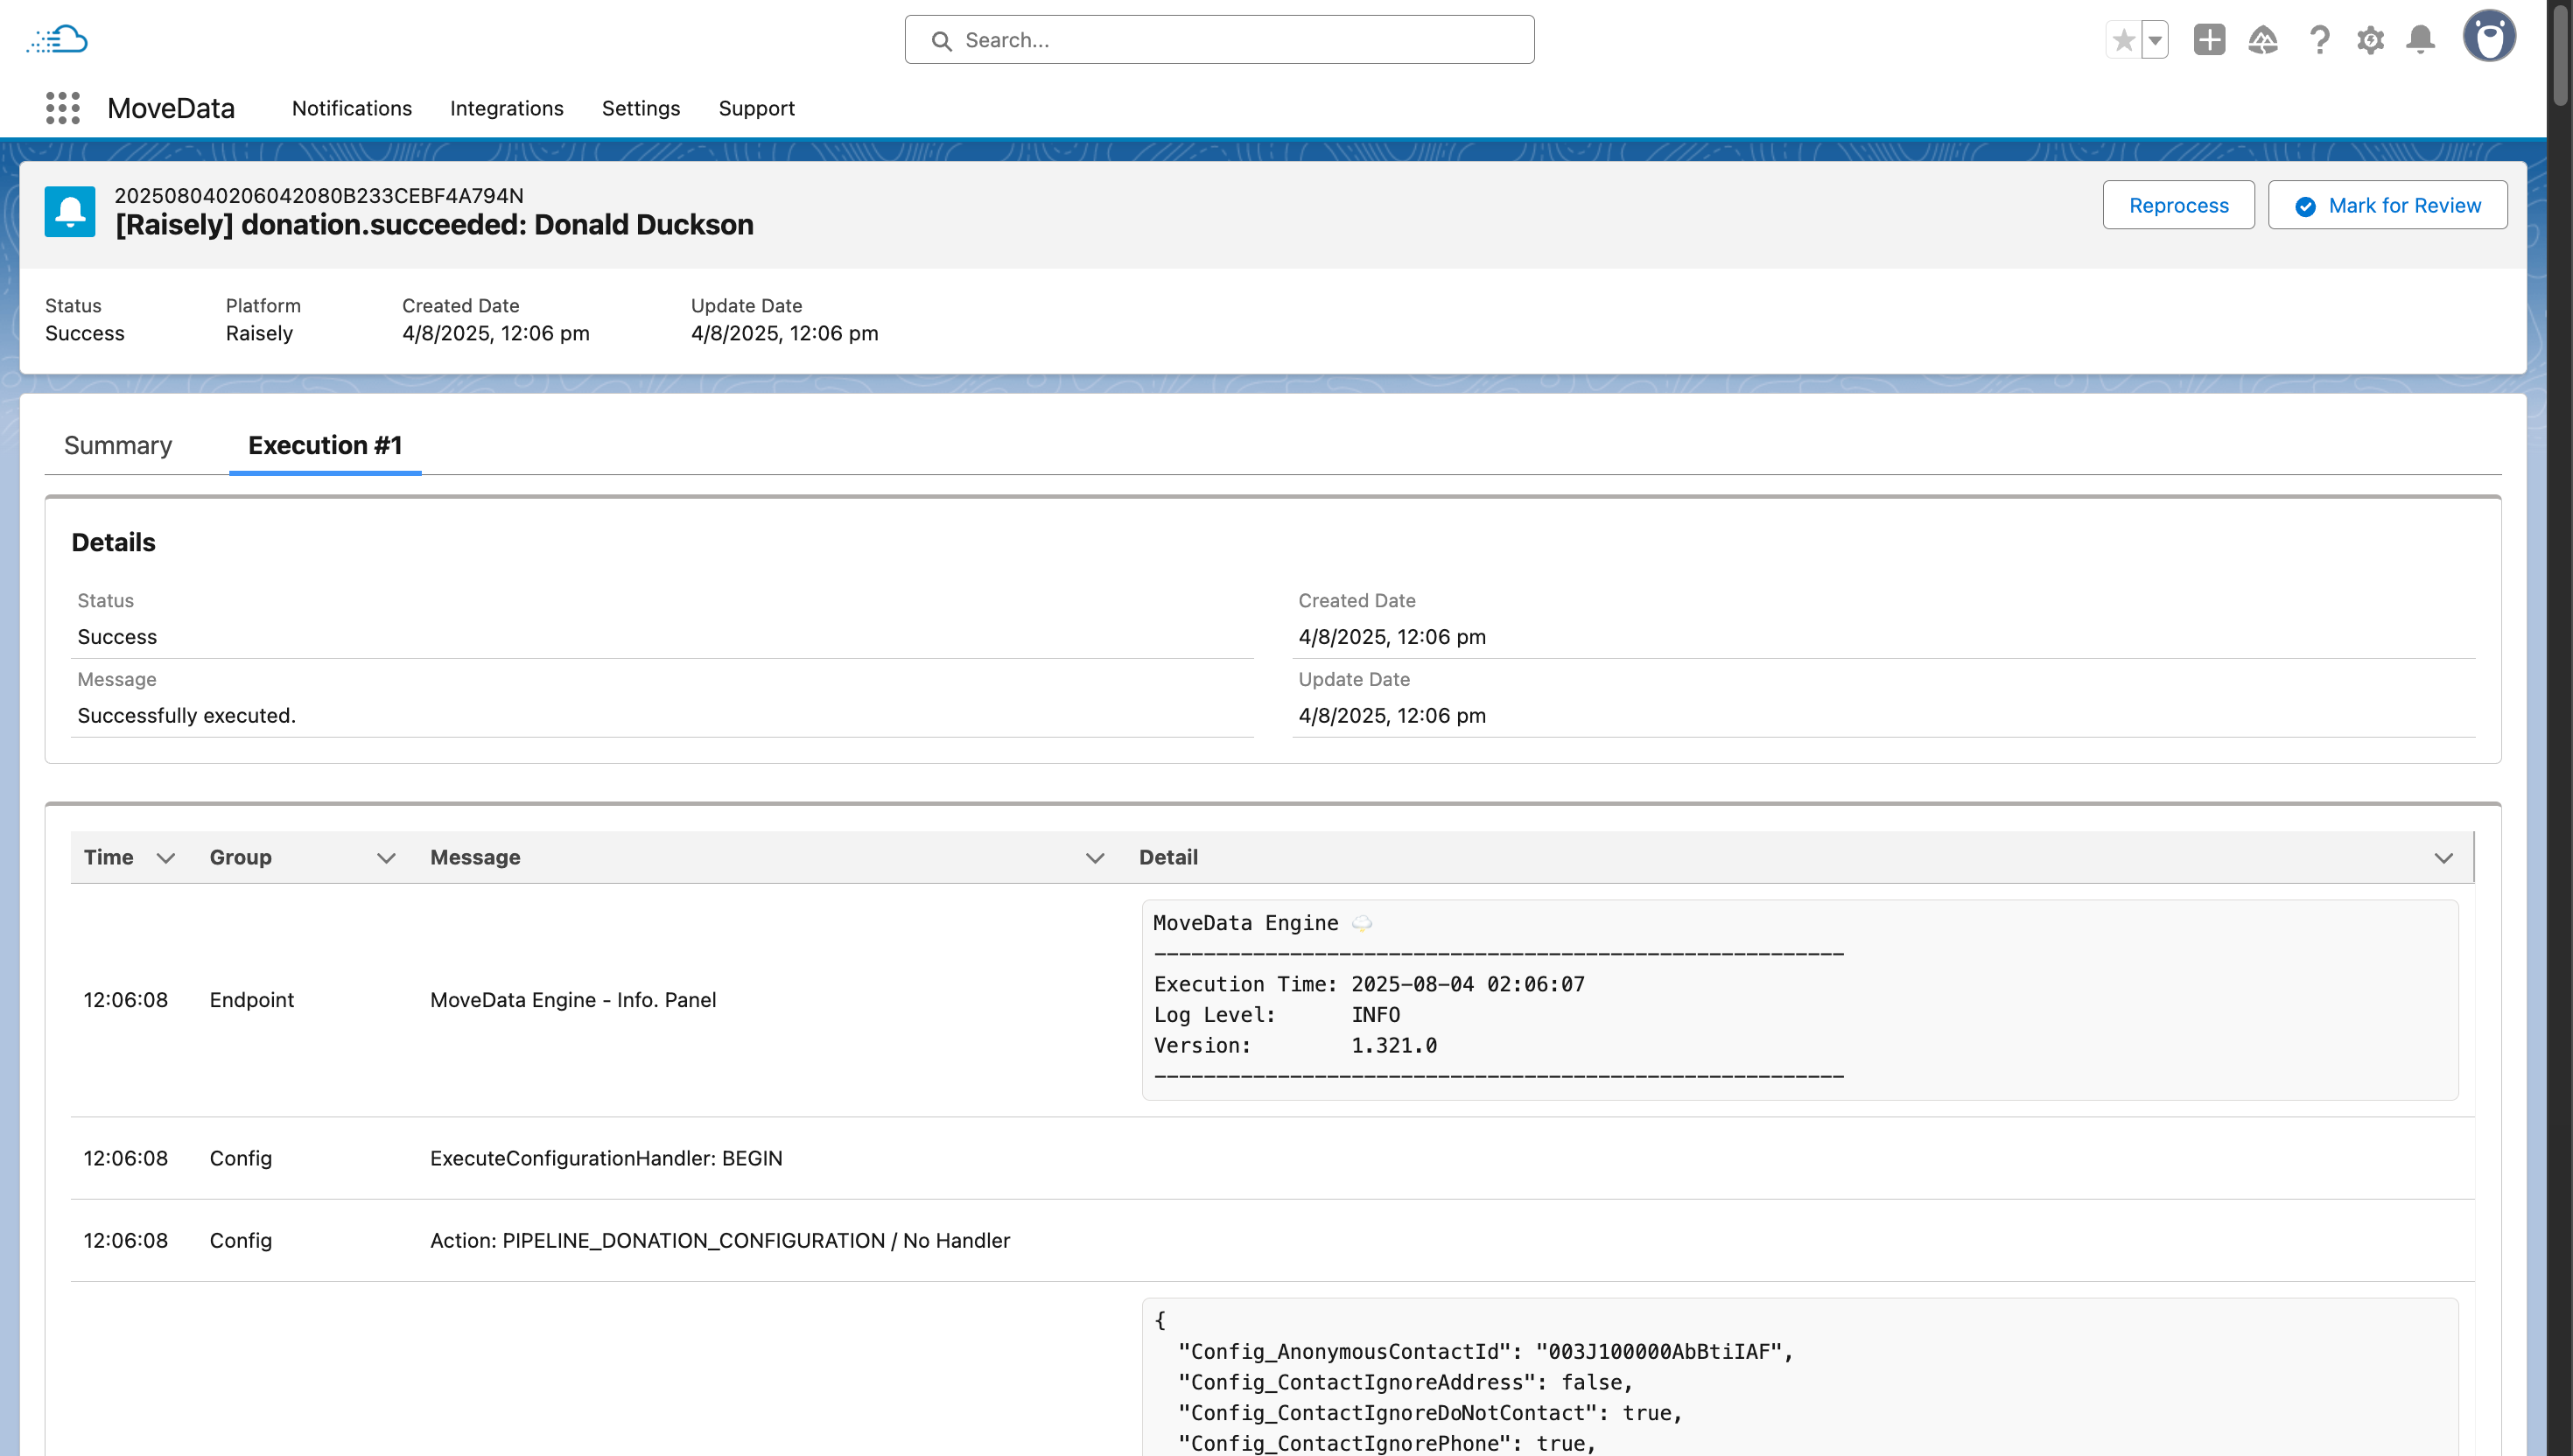
Reading the log#
The execution log displays entries in a table with four columns.
| Column | What it tells you |
|---|---|
| Time | The timestamp when that processing step occurred. |
| Group | The processing phase, such as "Duplicate Check" or "Record Creation". |
| Message | A short description of what MoveData did at that step. |
| Detail | Additional context, including field values, matched records, or error messages. |
How to read the columns together#
- Time helps you see the processing sequence and spot steps that took longer than expected.
- Group lets you jump to the processing phase you care about. Entries within the same group relate to the same operation.
- Message gives you the headline for each step. Scan these to follow the processing flow.
- Detail is where you find the specifics — the field values that were mapped, the duplicate rules that matched, or the exact error that caused a failure.
Using the Variable Inspector#
The Variable Inspector lets you see the data values that MoveData was working with at each processing step.
- Find the log entry you want to inspect.
- Click View Variables on that entry.
- A panel opens showing all variable names and their values at that point in processing.

The Variable Inspector includes two helpful controls:
- Search — type a variable name or value to filter the list. This is useful when you have many variables and need to find a specific one.
- Hide null toggle — turn this on to hide variables that have no value. This reduces clutter and helps you focus on the data that was actually present.
Success
The Variable Inspector is especially useful when troubleshooting field mapping issues. You can see the exact values MoveData received from the platform and compare them to what you expect.
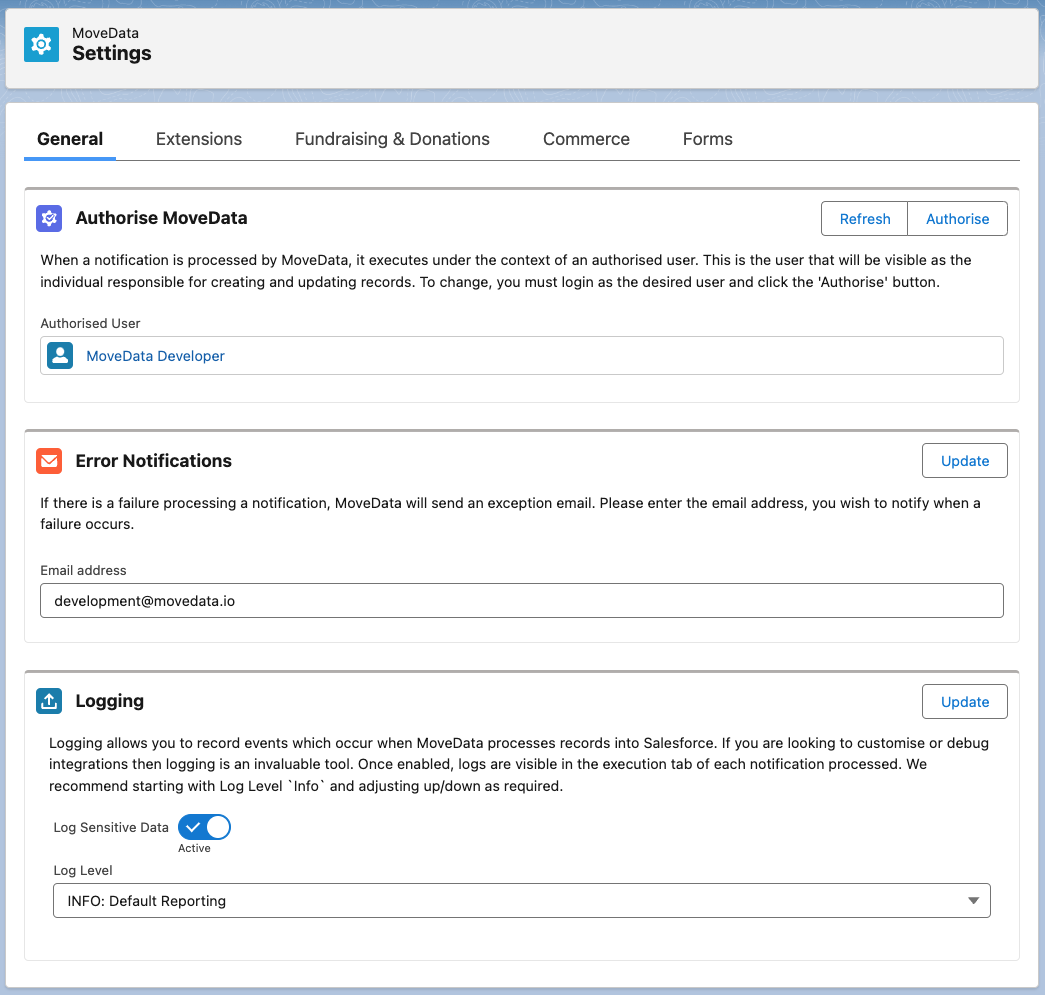
Log settings#
You control execution logging from the MoveData app settings.
- Open the MoveData app.
- Go to the Settings tab.
- Select General.
- Scroll to the Logging section.
Log level#
The Log Level setting controls how much detail MoveData records.
| Level | What it captures |
|---|---|
| ERROR | Only errors that caused processing to fail. |
| WARN | Errors and warnings about potential issues. |
| INFO | Errors, warnings, and general processing steps. This is the recommended level for most organisations. |
| DEBUG | Everything, including detailed internal operations. Use this only when troubleshooting a specific issue. |
Note
Higher log levels (such as DEBUG) generate more data and may use more storage. Use INFO for day-to-day monitoring and switch to DEBUG temporarily when you need to investigate a problem.
Log Sensitive Data#
The Log Sensitive Data toggle controls whether MoveData includes values from the Salesforce records it interfaces with during notification processing in the execution log.
- Off (default) — Salesforce record values are not included in log entries. This is recommended for day-to-day use.
- On — Salesforce record values are logged alongside each processing step. Turn this on temporarily when you need to troubleshoot a specific data issue, then turn it off again.
Note
Enabling Log Sensitive Data is useful when you need to see the actual field values MoveData is reading from or writing to Salesforce during processing.
Common log patterns#
Successful processing#
A successful notification log typically shows entries like:
- Group: Ingestion — data received and parsed.
- Group: Duplicate Check — checked for existing records, with the outcome noted.
- Group: Record Creation or Record Update — Salesforce records created or updated.
- No error entries at any stage.
Failed with error#
A failed notification log usually contains:
- Normal processing entries up to the point of failure.
- An error entry in the Message or Detail column describing what went wrong.
- The Group column tells you which processing phase failed (for example, "Record Creation" if a Salesforce validation rule blocked the insert).
Matched existing record#
When MoveData's duplicate detection finds a match, you typically see:
- Group: Duplicate Check — an entry stating that a matching record was found.
- The Detail column shows which duplicate rule matched and the ID of the existing Salesforce record.
- Depending on configuration, processing either continues with an update or the notification is skipped.
For more on how duplicate detection works, see Duplicate rules.
Tips for troubleshooting using the log#
- Start with the last entry — if a notification failed, the final log entry usually contains the error that stopped processing.
- Check the Group column — this tells you which phase failed, narrowing down where to look.
- Use the Variable Inspector — compare the incoming data values against your Salesforce field requirements to spot missing or malformed data.
- Switch to DEBUG temporarily — if the log does not contain enough detail, change the log level to DEBUG, reprocess the notification, and review the expanded log. Remember to switch back to INFO afterwards.